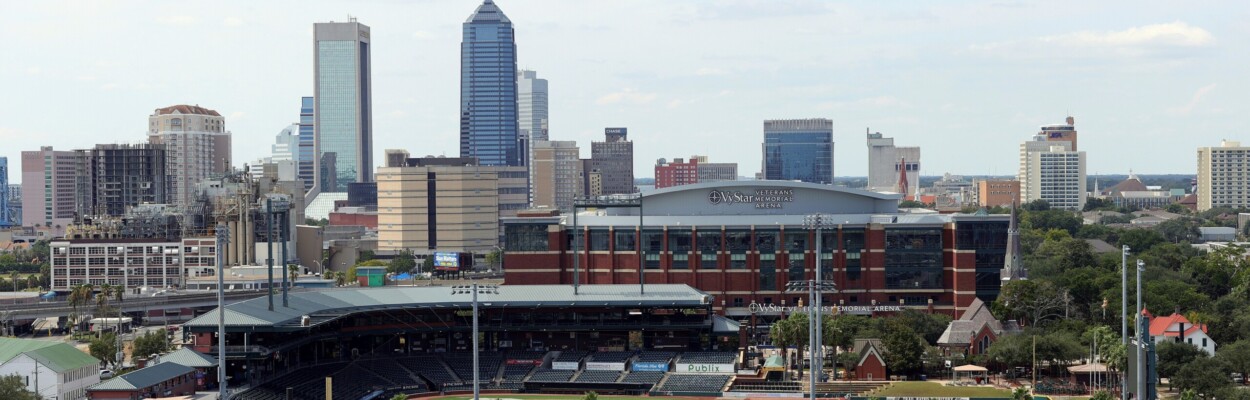
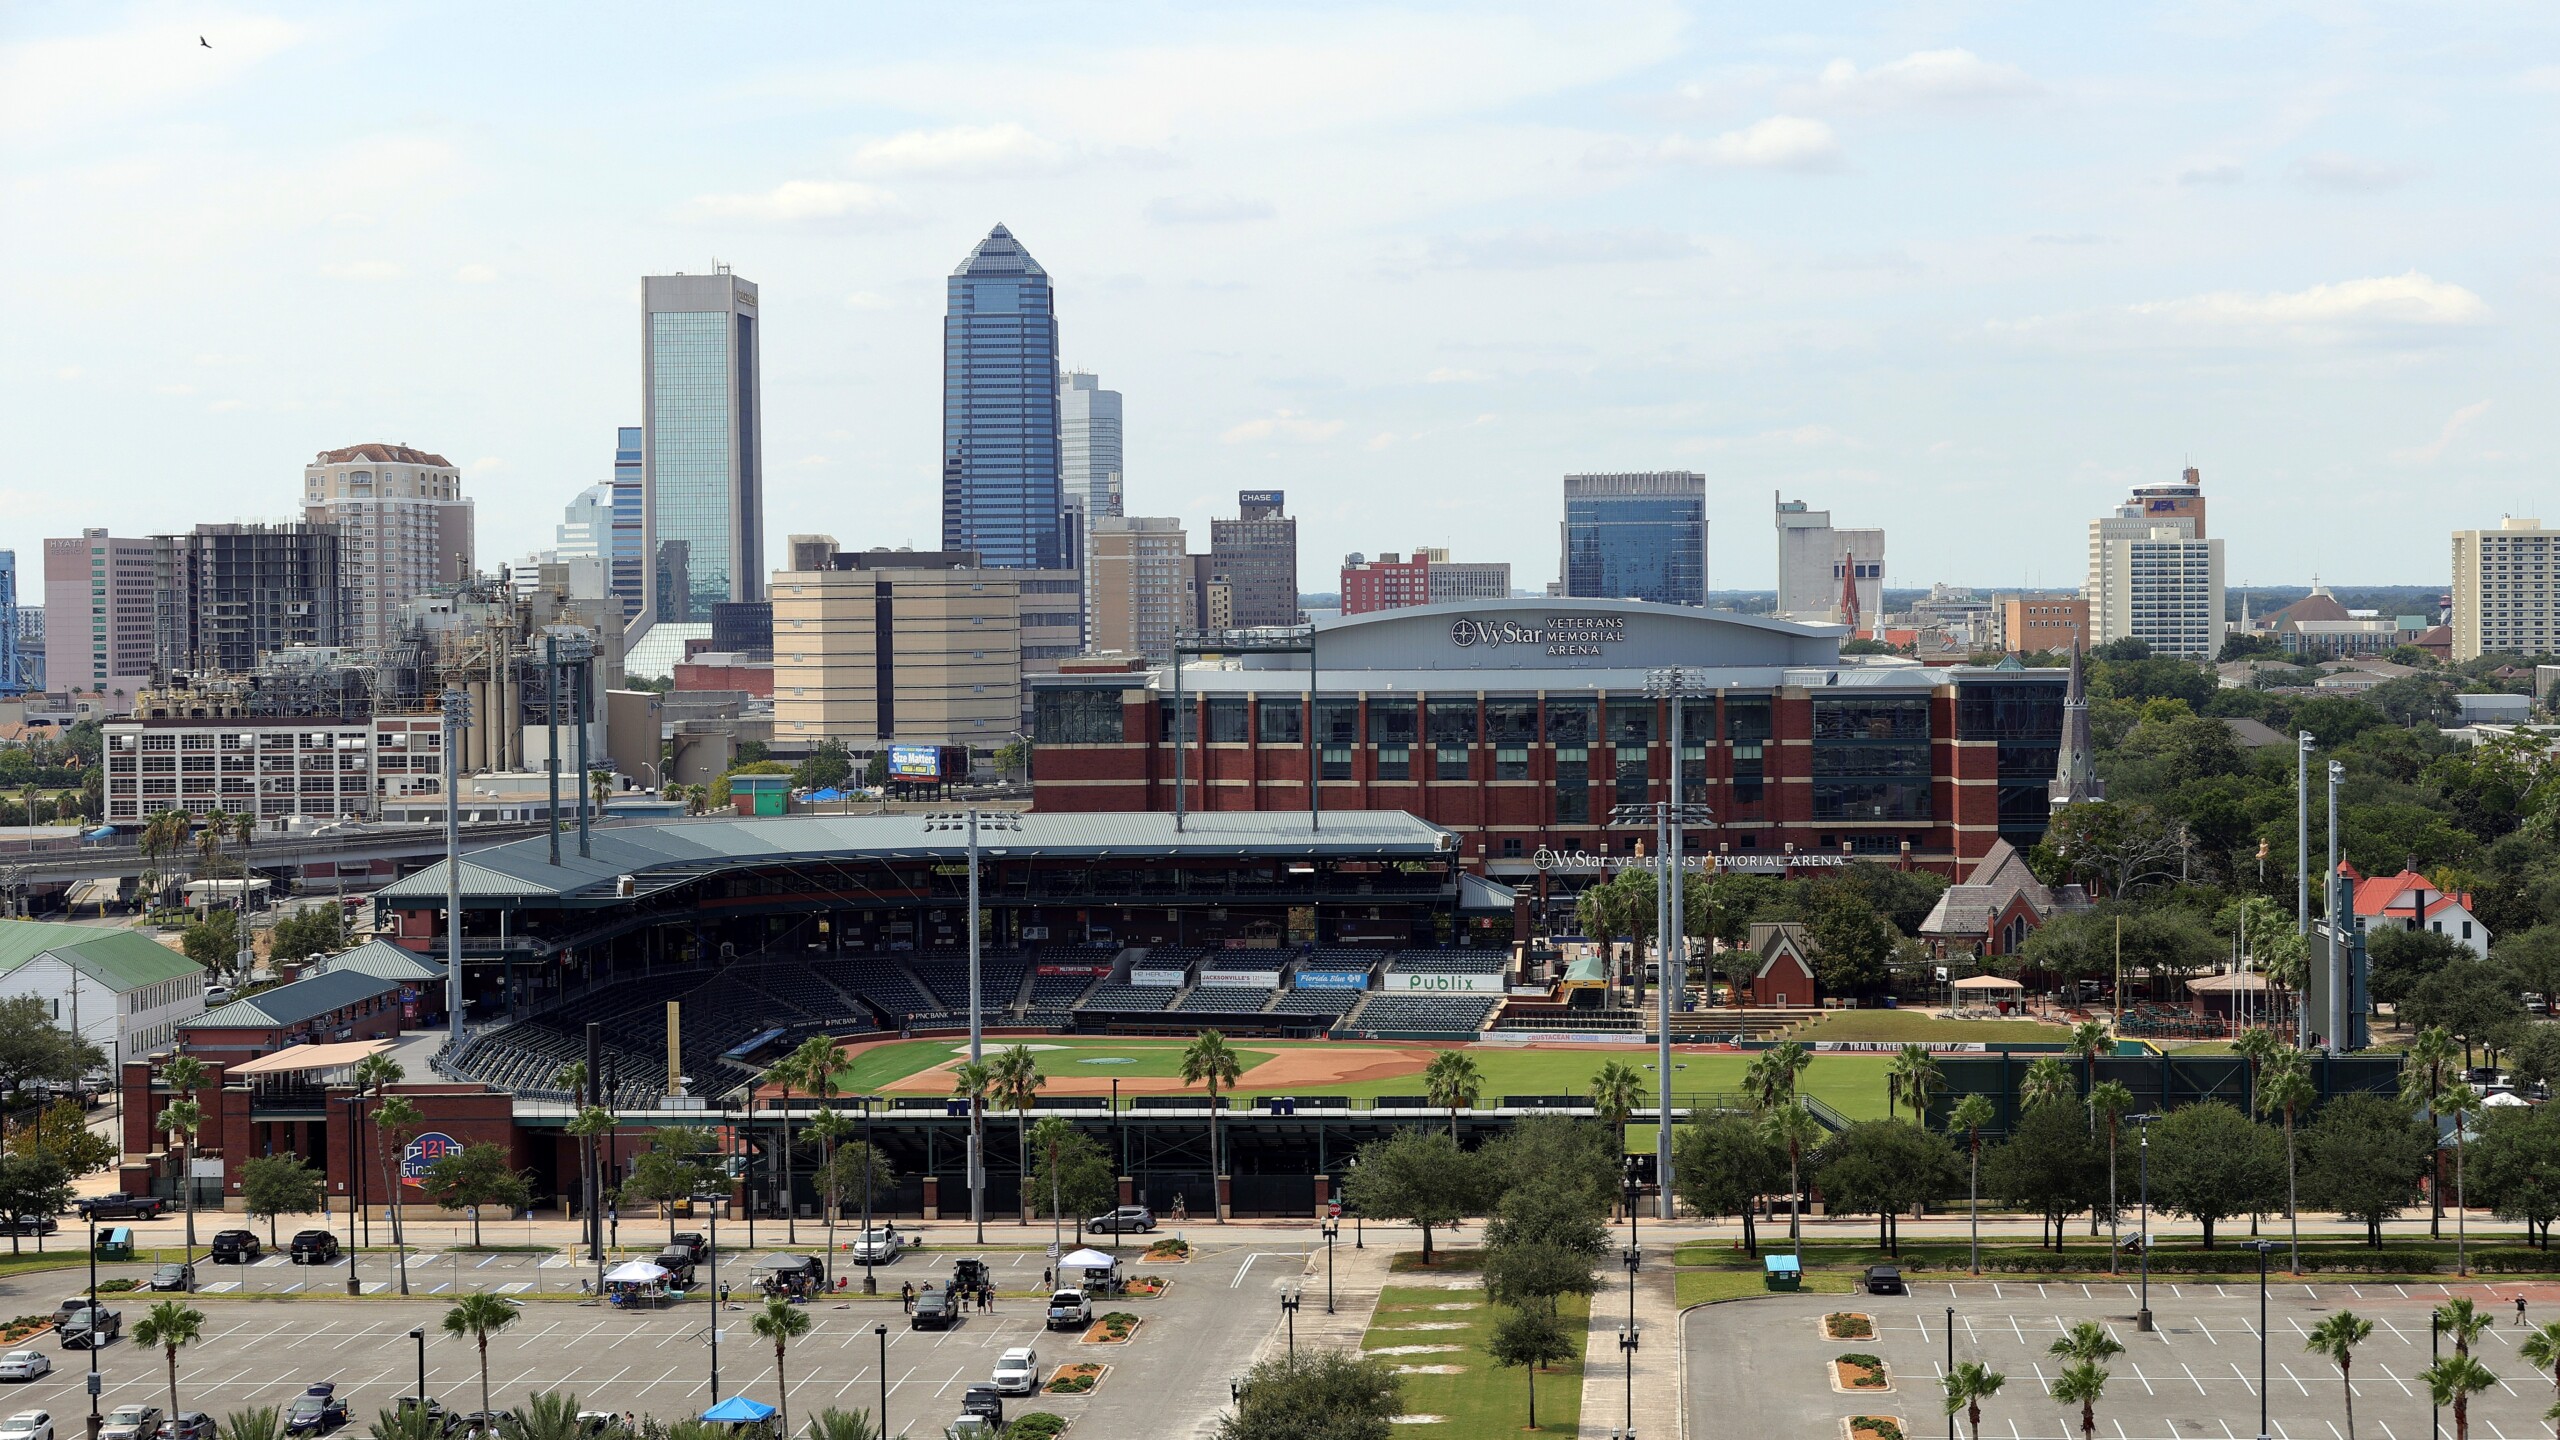
A view of VyStar Veterans Memorial Arena and 121 Financial Ballpark in Jacksonville. (AP Photo/Tyler Kaufman)
Published on July 14, 2022 at 5:29 pm
Free local news and info, in your inbox at 6 a.m. M-F. Sign up for the Jacksonville Today newsletter.
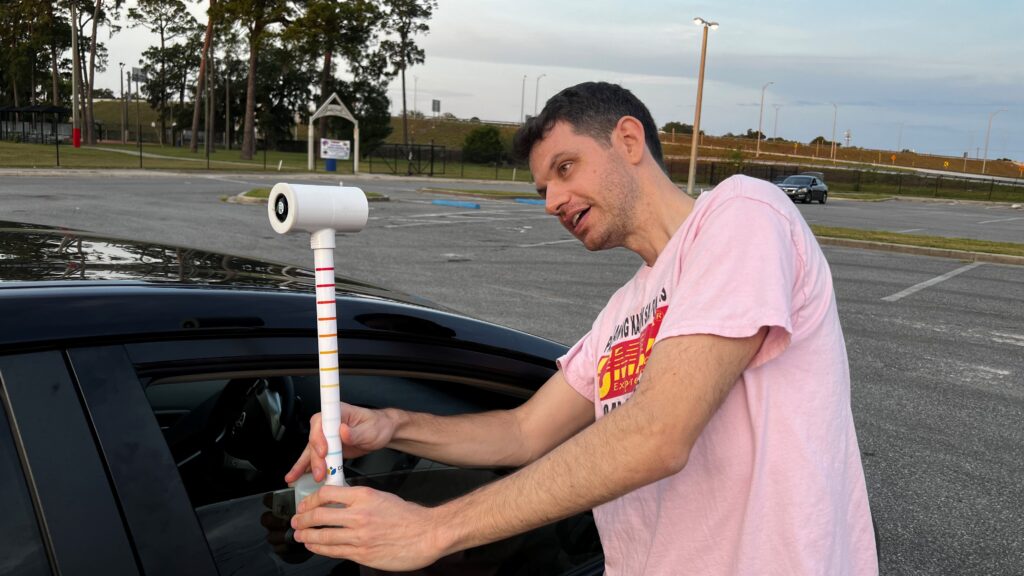
It’s 6 a.m. on a Saturday and University of North Florida biology professor Adam Rosenblatt is using his day off to drive around just north of Downtown Jacksonville. The sensor sticking out of his car window is collecting temperature data along the way.
Rosenblatt is the co-founder of the local chapter of the Citizens Climate Lobby, a volunteer-driven nonprofit focused on climate change solutions. His own research is on how climate change is affecting alligator eggs, but over the past few months he’s been preparing for this, a city-wide “heat mapping” project.
Jacksonville Today thanks our sponsors. Become one.
“The goal is to create a map of heat for as much of the city as possible. And that’s important because Jacksonville is already hot, but it’s projected to get much hotter, which can become a serious public health issue, as well as an issue for the infrastructure of the city,” Rosenblatt explains. “By having sort of this baseline heat data, the city can use that to make plans for the future for how to make the city more resilient to heat stress.”
Rosenblatt’s Prius is one of 30 cars outfitted with a heat sensor that are driving predetermined routes around Jacksonville three times: once at 6 a.m., again at 3 p.m. and a final time at 7.
Fletcher High student Grant Tucker and his father are in another car.


Jacksonville Today thanks our sponsors. Become one.
The 17-year-old’s passionate when it comes to climate change. He even started his own nonprofit: Co2nsequences Inc. “Our main goal is pretty simple: Save the world,” says Tucker.

Tucker first heard about the heat mapping campaign on the news.
“My parents were all for it and they also got involved in the movement,” he says. “They realized it shouldn’t just be my generation. I shouldn’t be protesting, picking up recyclables… I shouldn’t have to do these things, but it’s the reality of the world.”
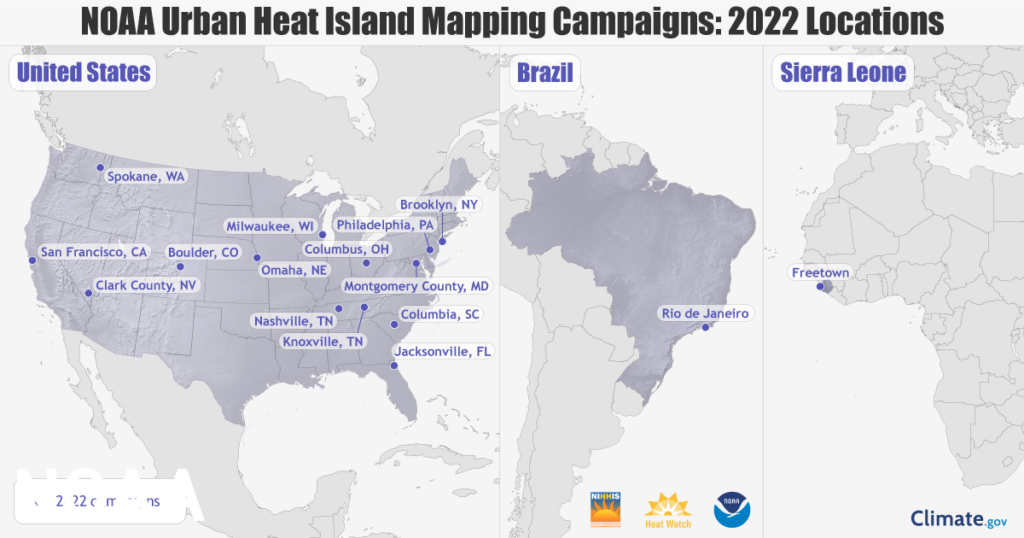
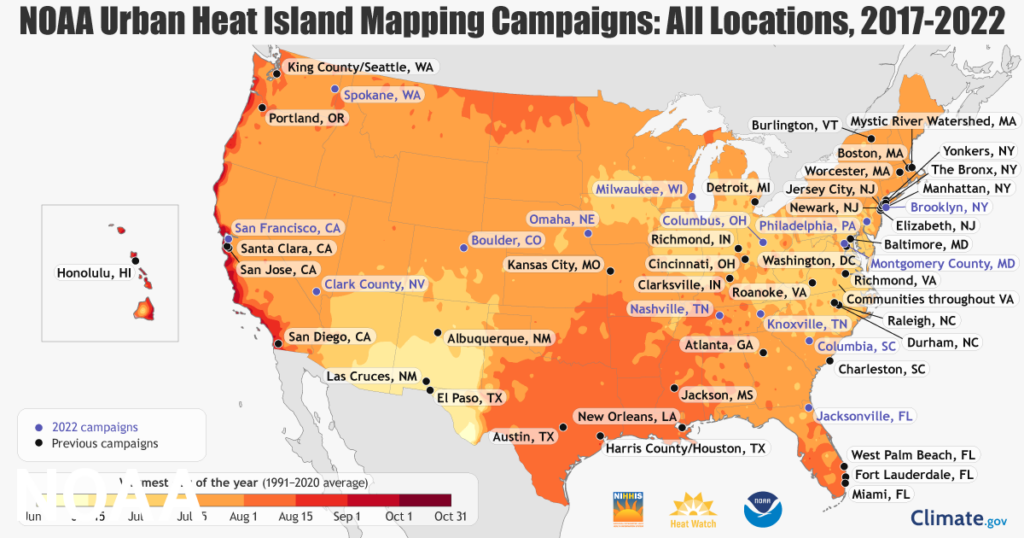
Jacksonville is the first, and one of the biggest cities, that will be heat mapping this year. It’s part of an annual effort of the National Oceanic and Atmospheric Administration that started five years ago. Through the NOAA funded program, CAPA Strategies, LLC provides heat sensors, then analyzes and models the collected data. Last year’s campaign saw 799 citizen scientists collect 1.2 million measurements in 24 communities.
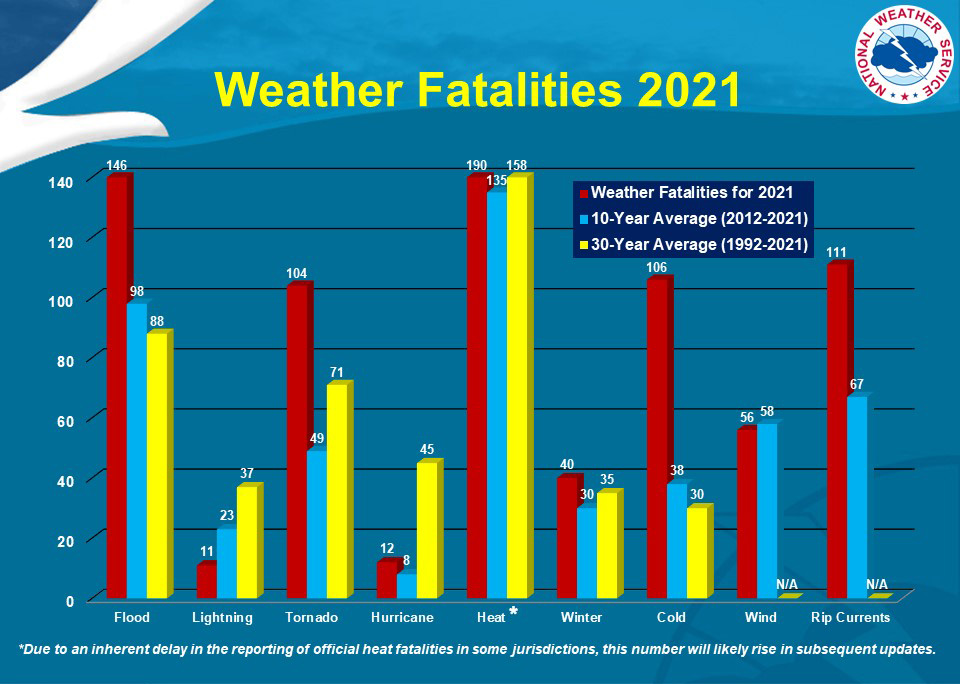
“Extreme heat kills more Americans every year than any other weather-related event,” says Morgan Zabow with NOAA’s climate program office. “So it is imperative that we’re working with communities to address this issue and make communities cooler, safer places for the current and future generations.”
Zabow says the heat maps will help cities better understand how they’re being affected by what’s known as the urban heat island effect.
“Cities, roads and buildings gain heat during the day and then they radiate that heat back into the surrounding air, which can lead to cities’ being 15 to 20 degrees Fahrenheit warmer than areas with more green spaces,” she explains.
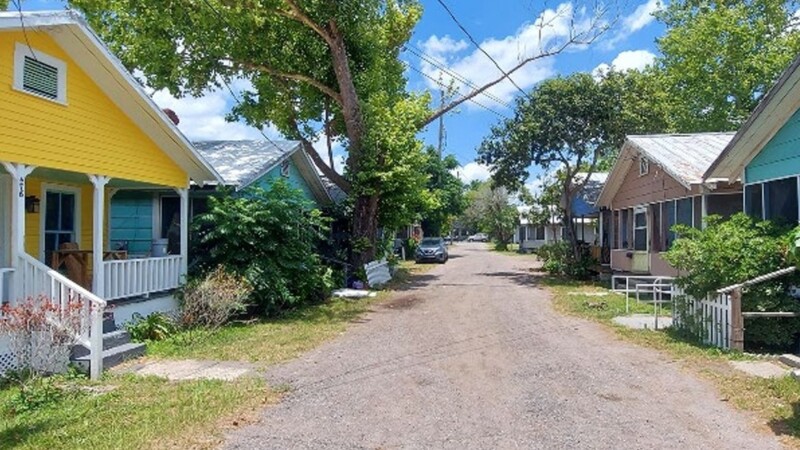
Temperatures can vary dramatically among neighborhoods too, with low-income and predominantly Black and brown communities getting the hottest. Previous research showed that land surface temperatures in Jacksonville neighborhoods that were historically discriminated against under redlining policies are now close to 10 degrees hotter than in tree-heavy, historic neighborhoods — which tend to be wealthier and mostly white.
Zabow says the data collected through this heat mapping campaign will be more accurate than ever. “If you are to put your hand on the sidewalk, land surface temperature is how hot the sidewalk would feel. But this doesn’t represent the human experience of heat.” You also need to look at air temperature, humidity, wind and more, she says. And the heat mapping campaign does just that.
Other communities have used data from their heat maps in a variety of ways. Harris County, Texas, incorporated their 2020 heat map data into a resilience strategy. Honolulu, Hawaii, posted its data as an online social vulnerability map that was used to inform tree plantings. The data has also been used by science museums in Boston and Richmond, Virginia.
Like Harris County, Texas, Jacksonville will incorporate its heat mapping data into the resilience strategy that’s in the works at City Hall. Jacksonville’s Chief Resilience Officer Anne Coglianese says an ongoing flood vulnerability study will factor in as well.
“We’ll be able to layer these two data sources together and fold in some Census data so that we have a complete picture of what vulnerability looks like in Jacksonville,” she says.
Jacksonville could get its final heat map report by September at the earliest, according to NOAA. Other cities that are mapping their heat this year include Philadelphia, Nashville, San Francisco and Brooklyn. NOAA’S heat mapping program is now part of the Biden Administration’s Justice40 initiative, which aims to ensure that federal agencies are working with state and local communities to make good on the president’s promise to deliver at least 40% of the benefits from federal investments in climate and clean energy to disadvantaged communities.